The Six-Way Epic: Digging Further into FLOSS Repositories

Not too long ago, I announced the publishing of my first journal article co-authored with Andrea Capiluppi and Cornelia Boldyreff. My mother was very proud — even if she did not understand a single word of it. I will give a brief summary of the article in this post, and if I succeed in whetting your appetite then you can go over to those nice people at Elsevier and buy the article.

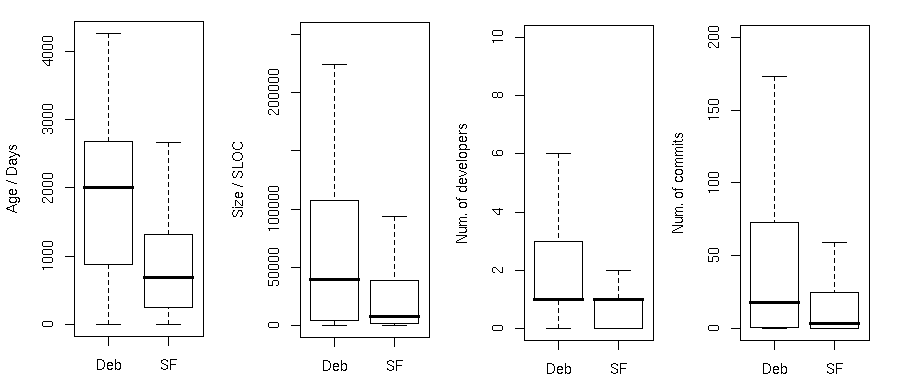
The work examines a number of FLOSS repositories to establish whether there are substantive differences between them in terms of a handful of evolutionary attributes. My previous work on this issue has already been discussed in earlier posts. The earlier work compared a Debian sample of projects to a SourceForge sample. The attributes compared were:

  • Size (in lines of code);
  • Duration (time between first and last commit to the version control system);
  • Number of developers (monthly average);
  • Number of commits (monthly average).

It was found that Debian projects were older, larger, and attracted more developers who achieved a greater rate of commits to the codebase, all to a significant degree.

For the journal article we once again used this approach, but this time we cast our net wider and examined six FLOSS repositories, then set out to answer some questions. Is each repository significantly different to all others? Based on the results, what is the nature of these differences? And are there any notable similarities among repositories — after all, some of the repositories are very similar on the surface, as you will see. The chosen repositories were:

  • Debian — a GNU/Linux distribution that hosts a large number of FLOSS projects;
  • GNOME — a desktop environment and development platform for the GNU/Linux operating system;
  • KDE — another desktop environment and development platform for the GNU/Linux operating system;
  • RubyForge — a development management system for projects programmed in the Ruby programming language;
  • Savannah — acts as a central point for the development of many free software projects particular associated with GNU;
  • SourceForge — another development management system for FLOSS projects, and a very popular one at that.

Once again we took a sample of projects from each repository and analysed each one to obtain the four metrics listed above. These values were aggregated together per repository. For an initial idea of the distribution of values we have these boxplots:

Boxplots of measured attributes per repository

To answer the first question (is each repository different to all others) the answer is definitely no; some differences are clearly hinted at by the boxplots. To ascertain more about these differences, and answer the subsequent questions, we carried out paired comparisons for each repository (with 6 repositories that gives 15 combinations, hence 15 comparisons). For each comparison the difference was tested to see whether it was statistically significant or not. The exact figures are printed in the article, but this is the summary of what was found.

  • Size: Debian was the clear winner. Projects in KDE and GNOME were of notably similar size, as were those in Savannah and SourceForge. The former group projects were smaller on average than those in the latter;
  • Duration: These results furnished perhaps the most striking evidence of a measurable divide between the attributes of the chosen repositories (Debian, KDE, and GNOME on one hand, and RubyForge, Savannah and SourceForge on the other), which was observable in some other attributes . We were also suspicious of the RubyForge results given the extreme youth of the projects;
  • Developers: Another divide between the two “groups” identified above;
  • Commits: As with the average number of developers, Debian, GNOME and KDE all manage a higher rate of commits, but the significance of the differences from the other three repositories is weaker. We also suspect the RubyForge commit rate to be artificially high. As already noted, the projects in the RubyForge sample tended to have a very low duration. After a little deeper digging, we suggest that the projects in our sample may have been “dumped” into the repository (which records a number of commits) and quickly ceased any development activity, thereby inflating the monthly rate .

As mentioned above, detailed figures, procedures and conclusions are available in the printed article. And it does not end there… later in the article we went further. The patterns we found among the repositories were formulated into a framework for organizing FLOSS repositories according to evolutionary characteristics. This may have impact on individual projects existing in, and moving through, the ecosystem of repositories — definitely of interest to both researchers and developers alike, I hope.

Digital Archaeology

Part of the use to which I’d like to put this blog is to disseminate information about research methods and tools. But before I start writing posts with involved details it’s probably prudent to present some sort of overview of the whole thing. Of course, there is no single method that is used by all computer scientists, although each method usually tries to approximate the scientific method as closely as possible. Hence, what I have to talk about is not the method utilized by all researchers, but it is a common one in the sub-field of free/open source and software evolution.

It was, I think, Daniel German who first suggested the role of a software evolutionist — a kind of palaeontologist, or private investigator, of software. Like a detective or an archaeologist, the software evolutionist arrives at the scene. Before her is a program listing, thousands of lines long. She doesn’t know how it got to be in the state she finds it, but clues may be available for her to piece its development together.

Linux kernel growth
Linux kernel growth

Besides the code, there’s the support documentation (maybe that will tell her how the program is meant to function). Also open on the computer is a forum where all the developers communicate (perhaps this will shed some light on what the developers were assigned). And on the server is a version control system, a treasure trove of clues that shows exactly which developers did what, and when they did it.

Unlike the detective we’re not trying to find a murderer of course, but we are trying to piece together how the program developed over time, i.e. how it evolved. An early example of this was done by Michael Godfrey and Qiang Tu: with nothing but a load of historical releases of the Linux kernel between 1994 and 1999, they showed that the kernel grew at a super-linear rate (it grows by a larger amount as time goes by) and identified which parts of the kernel were responsible for this surprising growth. (Spoiler: the portion of the kernel that contains device drivers was the biggest driver of this growth.)

So how do software evolutionists do it? As I said I can’t speak for them all, but I’ll try to articulate an abstract version of the steps that I and others go through, and assume it approximates the experience of the rest.

Roughly speaking the typical steps involve:

  • Selection: Both of the project to study and the measures you wish to apply;
  • Retrieval: Getting hold of the software (not always easy!) and storing it appropriately;
  • Extraction: Parsing the raw data, extracting the pieces you are interested in, and constructing them into useful information;
  • Analysis: Applying the measures and performing your relevant test(s).

Analysis steps

In later posts of this category I’ll discuss the tools and techniques of each stage, and (hopefully) build up a picture of the method. For now, I’ll show trivially how an analysis of the Linux kernel size might fit in with this approach (taking cues from Godfrey and Tu’s study where possible).

  • Selection: The Linux kernel is selected as a large exemplary open source project. Because the size is the attribute of interest, the number of lines of code is taken as a measure of size. To be scientific we should form some testable hypotheses predicting what we expect to find.
  • Retrieval: Each kernel version release is available on the Linux Kernel Archives as a tar file. Godfrey and Tu downloaded 96 of the releases.
  • Extraction: Now the lines of code (LOC) are counted in each release. Godfrey and Tu applied the Unix command “wc -l” to all *.c and *.h files and used an awk script to ignore non-executable lines.
  • Analysis: By this point, there should be 96 numbers stored, each the size of a release in LOC. To get a visual, we can feed them into a plotting program and produce a nice graph like the one above. We could even go further and apply all sorts of fancy mathematics or models. Suffice it to say, by the end of this stage we should have some results that allow us to confirm or refute our earlier hypothesis.

Once all this is done, we can then put forward out conclusions. Like a scientific study, the experimental data we have obtained is the evidence that backs them up.

Debian vs. SourceForge – Round 3

The tour through the comparison between Debian and SourceForge comes to a close by questioning whether Debian acts as a catalyst to evolutionary activity when a project is inserted into the repository. It has already been strongly suggested that projects packaged in Debian are recipients of significantly greater rates of activity.

Of the 50 projects in the Debian sample, 22 of them had a known history of evolutionary activity (monthly averages of number of developers and number of commits) that pre-dated its insertion into Debian, providing us with a “before” and “after”. So we compared the before and after of each project.

Developers

In 18 out of 22 projects, the distinct number of developers increases after being added to Debian. The remaining 4 experience no change, and have only 1 or 2 known contributors.

Commits

All projects have a greater number of commits in the after period than in the before period. However, the rate of commits in each period (the total commits within that period divided by its duration) only increases for 10 of the 22.

Summary

In summary of this trilogy I can say, from an absolute standpoint, that our results suggest Debian projects tend to be older, larger, attract more developers and a greater amount of activity, and all to a very significant degree. Furthermore, from an evolutionary perspective, the “Debian effect” seems to cause the pool of developers contributing to a project to increase when it is packaged by Debian, along with a half-decent chance that activity increases also.

Debian vs. SourceForge – Round 2

And so, we revisit the posers put up in a previous post:

  1. Are Debian’s evolutionary characteristics significantly different to those of SourceForge?
  2. Does Debian act as a catalyst?

To answer these questions, we took a closer look at the software inside them. I’ll briefly explain the method here, but details of the steps will be part of later posts in the “Research Methods” strand.

We chose a mutually exclusive sample of 50 packages from Debian and 50 projects from SourceForge.  In both cases they were taken from the pool of “stable” projects only. They were all downloaded and each project’s activity was extracted from their version control system (using log commands) and recorded in a file. Then we delved into our little toolbox and used some nifty tools to extract the information we needed, that information being the project’s:

  • Age (time between first and last commit to the version control system)
  • Size (in lines of code)
  • Number of developers (monthly average)
  • Number of commits (monthly average)

Each attribute can be aggregated from the 50 projects into a summary value for the repository. So, for example, we can take the ages of the 50 Debian projects and use them to get a mean or a median age. If we do the same thing for SourceForge we can compare them.

And that’s just what we did.

And here’s just what we found:

Boxplots of measured attributes

Using statistical significance testing (again, I’ll cover this in a “Research Methods” post) we found that Debian projects had larger values for each attribute, i.e. they were older, larger, and attracted more developers who peformed a greater amount of work, all to a significant degree.

This leads us to our second question, is Debian responsible? Is it somehow a driver for these larger values? Our answer to this question comes in round 3.

Debian vs. SourceForge – Round 1

We all know about SourceForge and Debian. Although they have different purposes, they both act as repositories of free software, and most of the practitioners will know that Debian hosts what is considered to be the best projects — judged most worthy by its army of package maintainers. Conversely, many (but by no means all) SourceForge projects languish in obscurity; these are, at best, of little interest outside of the developers who run them, or, at worst, have completely stalled. It is conventional wisdom then that Debian projects receive much more activity from developers than those on communities like SourceForge.

So today’s research question is: How true is this? How much more activity (if at all) do projects in Debian actually receive than their counterparts in SourceForge? To answer this query, two quantifiable and measurable questions are proposed:

  1. Are the evolutionary characteristics of Debian projects significantly different from those in SourceForge? (In other words, do Debian projects receive so much more activity that we cannot conclude that random statistical noise is responsible for the difference?)
  2. Does Debian act as a “catalyst”, so that when project are entered into Debian’s repository, the activity around the project increases?

To answer the questions, we need to measure proxies of evolutionary activity. We chose:

  • Project age
  • Project size
  • Number of developers
  • Number of commits

How these attributes were measured, and how they helped to answer the questions, will be addressed in the follow-up post.