The Six-Way Epic: Digging Further into FLOSS Repositories

Not too long ago, I announced the publishing of my first journal article co-authored with Andrea Capiluppi and Cornelia Boldyreff. My mother was very proud — even if she did not understand a single word of it. I will give a brief summary of the article in this post, and if I succeed in whetting your appetite then you can go over to those nice people at Elsevier and buy the article.

The work examines a number of FLOSS repositories to establish whether there are substantive differences between them in terms of a handful of evolutionary attributes. My previous work on this issue has already been discussed in earlier posts. The earlier work compared a Debian sample of projects to a SourceForge sample. The attributes compared were:

  • Size (in lines of code);
  • Duration (time between first and last commit to the version control system);
  • Number of developers (monthly average);
  • Number of commits (monthly average).

It was found that Debian projects were older, larger, and attracted more developers who achieved a greater rate of commits to the codebase, all to a significant degree.

For the journal article we once again used this approach, but this time we cast our net wider and examined six FLOSS repositories, then set out to answer some questions. Is each repository significantly different to all others? Based on the results, what is the nature of these differences? And are there any notable similarities among repositories — after all, some of the repositories are very similar on the surface, as you will see. The chosen repositories were:

  • Debian — a GNU/Linux distribution that hosts a large number of FLOSS projects;
  • GNOME — a desktop environment and development platform for the GNU/Linux operating system;
  • KDE — another desktop environment and development platform for the GNU/Linux operating system;
  • RubyForge — a development management system for projects programmed in the Ruby programming language;
  • Savannah — acts as a central point for the development of many free software projects particular associated with GNU;
  • SourceForge — another development management system for FLOSS projects, and a very popular one at that.

Once again we took a sample of projects from each repository and analysed each one to obtain the four metrics listed above. These values were aggregated together per repository. For an initial idea of the distribution of values we have these boxplots:
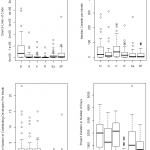
Boxplots of measured attributes per repository

To answer the first question (is each repository different to all others) the answer is definitely no; some differences are clearly hinted at by the boxplots. To ascertain more about these differences, and answer the subsequent questions, we carried out paired comparisons for each repository (with 6 repositories that gives 15 combinations, hence 15 comparisons). For each comparison the difference was tested to see whether it was statistically significant or not. The exact figures are printed in the article, but this is the summary of what was found.

  • Size: Debian was the clear winner. Projects in KDE and GNOME were of notably similar size, as were those in Savannah and SourceForge. The former group projects were smaller on average than those in the latter;
  • Duration: These results furnished perhaps the most striking evidence of a measurable divide between the attributes of the chosen repositories (Debian, KDE, and GNOME on one hand, and RubyForge, Savannah and SourceForge on the other), which was observable in some other attributes . We were also suspicious of the RubyForge results given the extreme youth of the projects;
  • Developers: Another divide between the two “groups” identified above;
  • Commits: As with the average number of developers, Debian, GNOME and KDE all manage a higher rate of commits, but the significance of the differences from the other three repositories is weaker. We also suspect the RubyForge commit rate to be artificially high. As already noted, the projects in the RubyForge sample tended to have a very low duration. After a little deeper digging, we suggest that the projects in our sample may have been “dumped” into the repository (which records a number of commits) and quickly ceased any development activity, thereby inflating the monthly rate .

As mentioned above, detailed figures, procedures and conclusions are available in the printed article. And it does not end there… later in the article we went further. The patterns we found among the repositories were formulated into a framework for organizing FLOSS repositories according to evolutionary characteristics. This may have impact on individual projects existing in, and moving through, the ecosystem of repositories — definitely of interest to both researchers and developers alike, I hope.
A Review of “Inside the Anthill: Open Source Means Business”

A recent radio broadcast on BBC Radio 4 (your grandmother’s favourite radio station) entitled “Inside the Anthill: Open Source Means Business” was advertised as “Gerry Northam goes behind the scenes to investigate ‘open source’ computer software“. (Spot the irony in going “behind the scenes” to investigate something that is done openly and transparently.) But let us immediately get one thing straight: the programme was mostly about the principles of openness and distributed collaborative projects in general, rather than exclusively about FLOSS. There is nothing wrong with that, of course, but I sympathize with the purist who finds it grating when the two are conflated. It also will not help the purist that the host does not get it quite right on occasion, such as by describing Linux as the first major open source project.

But still, this is radio for the generation of grandmother not Grand Theft Auto. Perhaps we should forgive some over-simplification? After all, the programme is clearly aimed at those who know little more than the phrase “open source” and who know it has something to do with computers. When the host is interviewing FLOSS developers (which is also when the programme is at its most interesting), he restricts his questions to the basics. The guys at Mozilla get the “why get involved?“, “how do you co-ordinate it all?“, and “who makes the decisions?” questions, while Linux, which seems to be held up as the exemplary FLOSS project, gets “why is it not more popular?“, “are people paid?“, and “where does the money come from?” The host promptly follows the money to IBM, and listens as members of the Linux Technology Centre give glimpses of their modus operandi.

After this, the show leaves the techies behind, and talks to people who apply the principle of open source outside of the computer world. We are treated to people from organizations like Wikipedia and Goldcorp, and from other observers, who give their predictions about open collaboration. Here is where my interest began to wane, because the talk starts to become a little woolly as the interviewees leave aside the specifics, and predict how businesses and governments will take the open principle and the new technology to become more democratic, cheaper, faster, better etc.

Finally, the show links back to its title by breaking down the analogy it set up in the first place (an open source project as a colony of ants), stating that a true anthill needs no hierarchy or centralized decision-making, things which are seen in the examples examined. (Think Linus and his lieutenants, or the guys who decide that Firefox needs to go to 3.5.)

In summary, being only half an hour in length, the programme could not have hoped to go into any real depth, but it may stoke the fires of general interest in the uninitiated listener.

Why I Like Linux (One Tiny Reason Further)

I use the Linux operating system at my place of work (I’ll refrain from revealing the flavour, lest we descend into religious wars). Because we do not have servers to provide common data storage or processing power off-site, I leave my machine running constantly and it acts as a server so I may access my materials whenever and wherever I need. This week, a kernel update was rolled out, meaning I needed to reboot. Just out of interest I wanted to see how long the machine had been running since the last reboot so I did:

$ uptime
15:02:01 up 63 days

Now I realize 63 days is peanuts in server time, but I still continue to be impressed that after more than eight weeks my system was as quick and responsive as when freshly booted… maybe I’m still coloured by my earlier experiences with a certain popular operating system. It certainly made me think on when I friend of mine, who uses Windows Vista and keeps her machine running overnight like me, remarked that it was time to reboot her machine because it had been running all week and was starting to run really slow.

Is this really still an issue with Windows machines? I’ve still never heard a satisfactory answer as to why this happens.

Digital Archaeology

Part of the use to which I’d like to put this blog is to disseminate information about research methods and tools. But before I start writing posts with involved details it’s probably prudent to present some sort of overview of the whole thing. Of course, there is no single method that is used by all computer scientists, although each method usually tries to approximate the scientific method as closely as possible. Hence, what I have to talk about is not the method utilized by all researchers, but it is a common one in the sub-field of free/open source and software evolution.

It was, I think, Daniel German who first suggested the role of a software evolutionist — a kind of palaeontologist, or private investigator, of software. Like a detective or an archaeologist, the software evolutionist arrives at the scene. Before her is a program listing, thousands of lines long. She doesn’t know how it got to be in the state she finds it, but clues may be available for her to piece its development together.

Linux kernel growth
Linux kernel growth

Besides the code, there’s the support documentation (maybe that will tell her how the program is meant to function). Also open on the computer is a forum where all the developers communicate (perhaps this will shed some light on what the developers were assigned). And on the server is a version control system, a treasure trove of clues that shows exactly which developers did what, and when they did it.

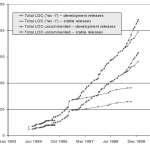
Unlike the detective we’re not trying to find a murderer of course, but we are trying to piece together how the program developed over time, i.e. how it evolved. An early example of this was done by Michael Godfrey and Qiang Tu: with nothing but a load of historical releases of the Linux kernel between 1994 and 1999, they showed that the kernel grew at a super-linear rate (it grows by a larger amount as time goes by) and identified which parts of the kernel were responsible for this surprising growth. (Spoiler: the portion of the kernel that contains device drivers was the biggest driver of this growth.)

So how do software evolutionists do it? As I said I can’t speak for them all, but I’ll try to articulate an abstract version of the steps that I and others go through, and assume it approximates the experience of the rest.

Roughly speaking the typical steps involve:

  • Selection: Both of the project to study and the measures you wish to apply;
  • Retrieval: Getting hold of the software (not always easy!) and storing it appropriately;
  • Extraction: Parsing the raw data, extracting the pieces you are interested in, and constructing them into useful information;
  • Analysis: Applying the measures and performing your relevant test(s).

Analysis steps

In later posts of this category I’ll discuss the tools and techniques of each stage, and (hopefully) build up a picture of the method. For now, I’ll show trivially how an analysis of the Linux kernel size might fit in with this approach (taking cues from Godfrey and Tu’s study where possible).

  • Selection: The Linux kernel is selected as a large exemplary open source project. Because the size is the attribute of interest, the number of lines of code is taken as a measure of size. To be scientific we should form some testable hypotheses predicting what we expect to find.
  • Retrieval: Each kernel version release is available on the Linux Kernel Archives as a tar file. Godfrey and Tu downloaded 96 of the releases.
  • Extraction: Now the lines of code (LOC) are counted in each release. Godfrey and Tu applied the Unix command “wc -l” to all *.c and *.h files and used an awk script to ignore non-executable lines.
  • Analysis: By this point, there should be 96 numbers stored, each the size of a release in LOC. To get a visual, we can feed them into a plotting program and produce a nice graph like the one above. We could even go further and apply all sorts of fancy mathematics or models. Suffice it to say, by the end of this stage we should have some results that allow us to confirm or refute our earlier hypothesis.

Once all this is done, we can then put forward out conclusions. Like a scientific study, the experimental data we have obtained is the evidence that backs them up.