Techniques for Selection

Analysis steps
Analysis steps

As we have seen before, this figure shows the stages of a typical approach to a post-hoc study of FLOSS, like a digital archaeologist. The figure shows a series of stages, each of which includes some number of steps, and yields some outcomes. Each outcome may or may not feed into the following stage. In this post, I will discuss the selection stage. Remember that this is the method I have preferred so far, and is the method that a number of my peers have used, in whole or in part. It is not the method.

Selection

The point of selection is to choose the metrics that are going to be used to measure the attributes you are interested in, and also to compose a list of projects to study. On selecting metrics, I cannot be especially general. They are very closely tied to the goals of your study and a way needs to be found to come up with an effective way of measuring your success at achieving those goals. My personal preference is the “Goal-Question-Metric” (GQM) Approach. You can read about it elsewhere, but what attracts me to the GQM Approach is that it is a software engineering specific method that helps you come up with the right measures by forming questions needed to achieve the goals you have set. These questions can also “suggest” the hypotheses needed in your study. It is not perfect, but “Goal-Question-Metric” is a useful parallel to “Research Question-Hypotheses-Measures”. I do think it important to do metric selection first; the reason will be apparent in what I shall say next.

Additionally, you will probably want to set some parameters for the investigation, usually to ensure your investigation remains valid. For example, if you looking into some aspect of, say, forum activity then it probably makes no sense to include projects for which no forum activity exists. (At the same time, you should report what proportion of your initial sample is disqualified.) This may impact the pool of projects you can choose from by eliminating some potentials, but it should not impact the metrics you choose — the investigation should be guided by what you want to measure, not how easy something is to measure. Sometimes this is made quite simple for you. For instance, FLOSSMole is a service that provides you with meta-data about individual FLOSS projects in nicely-formatted lists. If you wish to prune such a list then it is easy to write a software tool to do it quickly for you, leaving only the “valid” candidates. Ask nicely and you could borrow mine.

So-called “filters” I have found myself testing for in past work have included:

  • Programming language
  • Version control system used
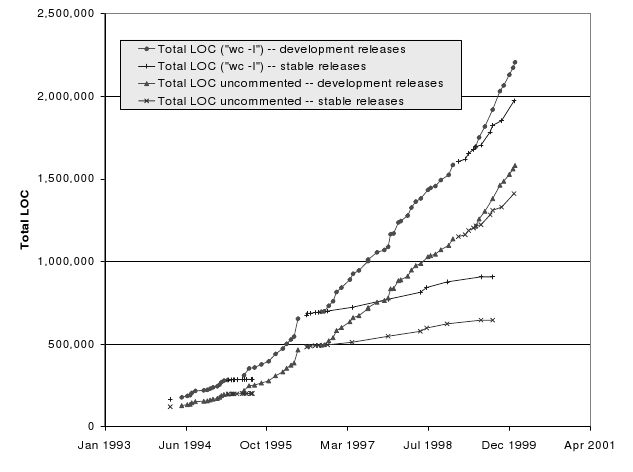
  • Product size
  • Development status

These factors can impact the validity of the study (e.g. can different programming languages be compared fairly), or be technical considerations (e.g. do I have tools that can analyse these programming languages). Both need careful thought.

Further considerations include your selection method, i.e. how are you choosing the projects to study? If you are examining a very small number of projects, be sure your choice has some careful thought behind it. Generalizing from simply analysing one or a couple of projects can be tricky; a more focused comparative analysis, such as the work by Schach et al comparing four different Unix-like operating system kernels is probably more productive at that level. If you seek to generalize FLOSS as a phenomenon from your analysis, some different works have now been carried out (including my own) that do so by analysing large samples of projects. In this case I think the consensus is that random selection of a filtered population of projects is the best approach.

And so the end of the selection process should be a list of projects you wish to analyse that feeds through to the next stage: retrieval.

Digital Archaeology

Part of the use to which I’d like to put this blog is to disseminate information about research methods and tools. But before I start writing posts with involved details it’s probably prudent to present some sort of overview of the whole thing. Of course, there is no single method that is used by all computer scientists, although each method usually tries to approximate the scientific method as closely as possible. Hence, what I have to talk about is not the method utilized by all researchers, but it is a common one in the sub-field of free/open source and software evolution.

It was, I think, Daniel German who first suggested the role of a software evolutionist — a kind of palaeontologist, or private investigator, of software. Like a detective or an archaeologist, the software evolutionist arrives at the scene. Before her is a program listing, thousands of lines long. She doesn’t know how it got to be in the state she finds it, but clues may be available for her to piece its development together.

Linux kernel growth
Linux kernel growth

Besides the code, there’s the support documentation (maybe that will tell her how the program is meant to function). Also open on the computer is a forum where all the developers communicate (perhaps this will shed some light on what the developers were assigned). And on the server is a version control system, a treasure trove of clues that shows exactly which developers did what, and when they did it.

Unlike the detective we’re not trying to find a murderer of course, but we are trying to piece together how the program developed over time, i.e. how it evolved. An early example of this was done by Michael Godfrey and Qiang Tu: with nothing but a load of historical releases of the Linux kernel between 1994 and 1999, they showed that the kernel grew at a super-linear rate (it grows by a larger amount as time goes by) and identified which parts of the kernel were responsible for this surprising growth. (Spoiler: the portion of the kernel that contains device drivers was the biggest driver of this growth.)

So how do software evolutionists do it? As I said I can’t speak for them all, but I’ll try to articulate an abstract version of the steps that I and others go through, and assume it approximates the experience of the rest.

Roughly speaking the typical steps involve:

  • Selection: Both of the project to study and the measures you wish to apply;
  • Retrieval: Getting hold of the software (not always easy!) and storing it appropriately;
  • Extraction: Parsing the raw data, extracting the pieces you are interested in, and constructing them into useful information;
  • Analysis: Applying the measures and performing your relevant test(s).

Analysis steps

In later posts of this category I’ll discuss the tools and techniques of each stage, and (hopefully) build up a picture of the method. For now, I’ll show trivially how an analysis of the Linux kernel size might fit in with this approach (taking cues from Godfrey and Tu’s study where possible).

  • Selection: The Linux kernel is selected as a large exemplary open source project. Because the size is the attribute of interest, the number of lines of code is taken as a measure of size. To be scientific we should form some testable hypotheses predicting what we expect to find.
  • Retrieval: Each kernel version release is available on the Linux Kernel Archives as a tar file. Godfrey and Tu downloaded 96 of the releases.
  • Extraction: Now the lines of code (LOC) are counted in each release. Godfrey and Tu applied the Unix command “wc -l” to all *.c and *.h files and used an awk script to ignore non-executable lines.
  • Analysis: By this point, there should be 96 numbers stored, each the size of a release in LOC. To get a visual, we can feed them into a plotting program and produce a nice graph like the one above. We could even go further and apply all sorts of fancy mathematics or models. Suffice it to say, by the end of this stage we should have some results that allow us to confirm or refute our earlier hypothesis.

Once all this is done, we can then put forward out conclusions. Like a scientific study, the experimental data we have obtained is the evidence that backs them up.

In The Beginning…

Why write a blog?

Well, why not. It seems like everyone else is.

I’ve been racking my brains to decide what I have to blog, or rather what is interesting enough to share with people. My field is computers; specifically research. I’ve been spending a few years researching free/open source software now, and I think I’ve got into the stride of things enough now to start to write about it.

In this blog, most of the time I plan my entries to fall into one of three categories:

  1. Posts about my research: I’ll share my various little findings that might be of interest to people who want to understand more about free/open source. I’ll try and make them as to understand as possible — if you want the real technical treatment, I’ll point you to the technical paper.
  2. About approaches to research: I also want to pass on the methods and tools you can use to carry out research on software. I hope this will be of interest to practitioners as well as researchers.
  3. Videos: Another little pet project of mine (called Computer Floss) is to produce a series of videos for a general audience that explains all the various facets of open source. I’ve already begun, and you can see them over at:

http://youtube.com/user/directrod

Don’t ask why my username there is directrod.